NHL Skater Leaders, 1988-89
The PaceNHL · 1988-89 · Regular Season · Archive
Show
2026-272025-262024-252023-242022-232021-222020-212019-202018-192017-182016-172015-162014-152013-142012-132011-122010-112009-102008-092007-082006-072005-062003-042002-032001-022000-011999-001998-991997-981996-971995-961994-951993-941992-931991-921990-911989-901988-891987-881986-871985-861984-851983-841982-831981-821980-811979-801978-791977-781976-771975-761974-751973-741972-731971-721970-711969-701968-691967-681966-671965-661964-651963-641962-631961-621960-611959-601958-591957-581956-571955-561954-551953-541952-531951-521950-511949-501948-491947-481946-471945-461944-451943-441942-431941-421940-411939-401938-391937-381936-371935-361934-351933-341932-331931-321930-311929-301928-291927-281926-271925-261924-251923-241922-231921-221920-211919-201918-191917-18
Art RossCoffey+38 clearBiggest climberHowe+15 by rate














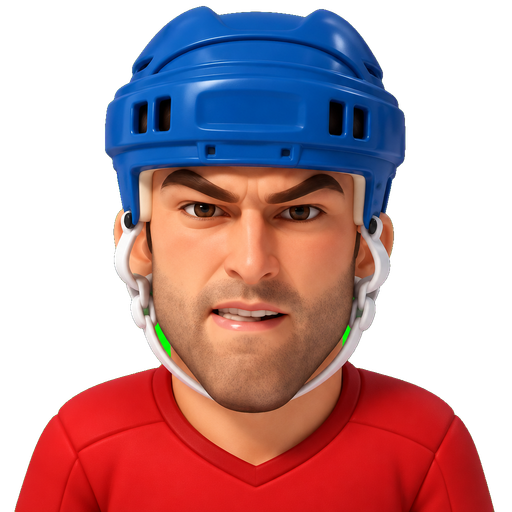







The Field31-40 of 228
| # | Player | G | A | PTS |
|---|---|---|---|---|
| 31 | 16 | 24 | 40 | |
| 32 | 13 | 27 | 40 | |
| 33 | 9 | 29 | 38 | |
| 34 | 9 | 29 | 38 | |
| 35 | 9 | 28 | 37 | |
| 36 | 9 | 26 | 35 | |
| 37 | 4 | 31 | 35 | |
| 38 | 8 | 26 | 34 | |
| 39 | 13 | 20 | 33 | |
| 40 | 8 | 25 | 33 |



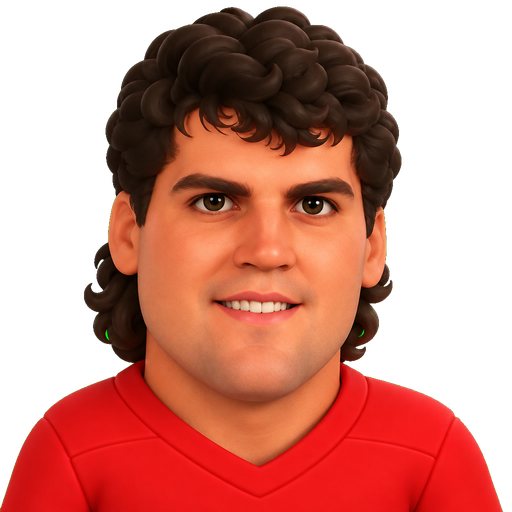





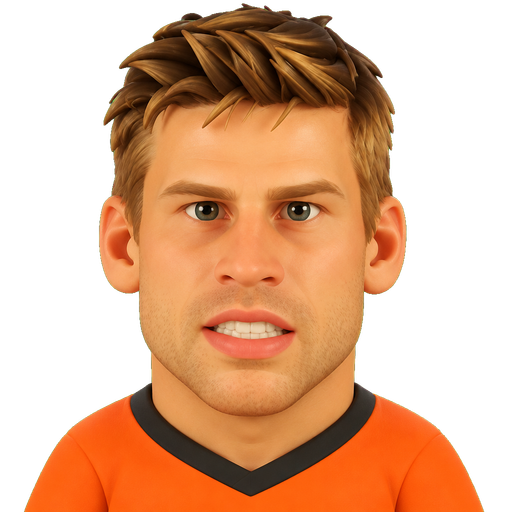
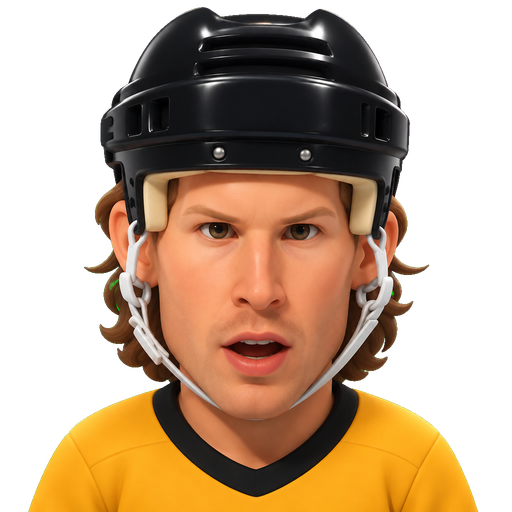






Reading the board
- Totals
- Ranked by season total.
- Per Game
- Ranked by per-game rate (a total divided by games played).
- / gm
- Per game: the stat divided by the games the skater played.
- ↑ / ↓
- How many places a skater moves when the board is ranked by per-game rate instead of totals. ↑ rises, ↓ falls.
- Pace
- The per-game leader, called out when it is a different skater than the totals leader.
- Climber
- The top-rate skater who gains the most places from the totals order to the per-game order - a scorer the raw totals underrate.
- clear
- How far ahead the leader finished, over second place.
- min GP
- The games-played cutoff to qualify for the per-game board, so a short hot streak cannot top it.
Stat key
- GP
- Games played
- G
- Goals
- A
- Assists
- PTS
- Points (goals + assists)
- +/-
- Plus/minus: even-strength goal margin while on the ice
- PIM
- Penalty minutes
- S
- Shots on goal
- S%
- Shooting percentage (goals / shots)
- PPG
- Power-play goals
- GWG
- Game-winning goals